
This is part 2 of a series of three blogs on the topic. This part covers the status of the global debt in relation to the GDP. To Read part-1, which deals with theoretical background click here .
What is status of the global debt vis a vis the GDP?
Chart 2 takes a look at the movement of the global debt (debts of all countries) for the last two decades. The total debt refers to the sum of the borrowings of the government, non-financial corporates and households. The debt to GDP ratio is the metric used to indicate an economy’s /country’s ability to pay back its debt. This is a comparison of what acountry owes to what it produces.

The chart 2 shows that the global debt at the beginning of the twenty first century stood at 198% of the global GDP, and rose to 200% the next year. That means the total debt stood at two times the GDP, or in other words, if the entire GDP was used to repay the debt, it will take two years to wipe out the debt. We notice two spurts in the steady growth of the global debt. The first one in 2009, the year following the first financial crisis of this century. The second jump in 2020 is the reflection of the current calamity, the covid19 pandemic. We shall discuss this in detail later.
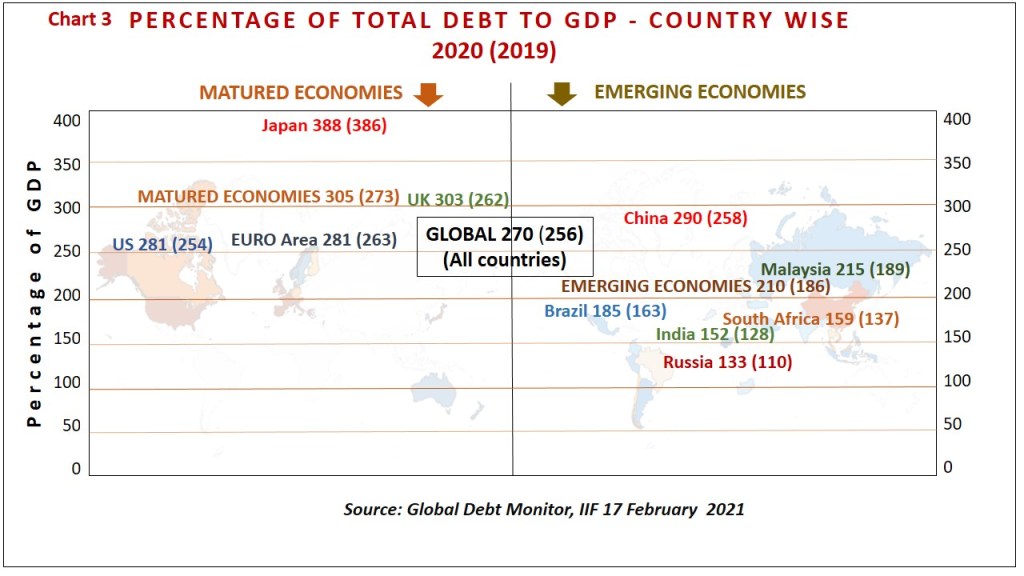
The chart 3 above takes a look at the debt position of some selected counrties both matured and emerging. The figures given in bracket pertains to 2019 and figures without the bracket for 2020, in the midst of the pandemic.
The debts have been mounting up through the years, as depicted in the earlier chart and the countries are now sitting on top of these mountains of debt with varying heights. The global debt, as also shown in the earlier chart, exceeds two and a half times the global GDP. Matured economies are perched on debt of 3 times its GDP, led by Japan with almost four times its GDP. Emerging countries have a lower debt burden, above two times the GDP. Among them China looks to be an exception with debts 2.9 times it’s GDP, scoring over US, and Euro area. The matured economies are worse off, in terms of debt, than the emerging economies.
What is wrong with debt?
There is nothing wrong in taking debt, as long as it leads to economic growth. A study conducted by Boston Consulting Group (BCG) revealed that an additional dollar of new debt in US resulted in only 18 cents increase in GDP in 2000-2010, while it was 59 cents in 1960s. Most of the countries are on debt which will not be paid off in the near future. According to Minsky’s description, major economies are in the stage of Ponzi financing. Minsky has purposely compared the debt with the income rather than with the value of assets, which is directly linked to the market conditions. The asset- liability correlation, dominant role of stock market, loose governance of corporates, lax vigilance by auditors and credit rating agencies and more are well explained by the British-American investment banker Mitch Feierstein, which led him to the conclusion he gave as the title of the his book Planet Ponzi.
What is the impact of covid19 on these debts?
In absolute terms, covid 19 surging the globe, the year 2020 has added $24 trillion to reach the peak of $281 trillion. The pandemic plays a double impact on the percentage figure. (a) Rise in the debts as a result of relief and stimulus measures undertaken by the governments entail huge funds, raised by borrowing and the corporates and individuals resorting to borrowing against drop in their cashflow. (b) Fall in GDP due to reduction in production days caused by extended lockdowns to ward off the pandemic.
Percentage of the borrowing to GDP is likely to move higher in 2021 with the covid 19 into its second wave across the globe and to third wave in some countries. In chart 3 a comparison of the figures within and without the bracket gives the impact of the pandemic on the debt after one calendar year. There is an overall impact on global debt of 14%. It has increased debt in matured economies by 32% and in the emerging economies by 24%. Among the various countries UK leads with 41% increase followed by China with an increase of 32%.
What will be the impact on the economy?
Most macroeconomists advocated ‘equilibruim models’, which states that the modern market economy is stable and grows in a steady way and an economic crisis will be generated only by external shocks like rise in oil price, war, technological breakthrough,..
Hyman Minsky disagreed with them and affirmed that the modern capitalist economy could generate shocks through its own internal dynamics explained in his ‘financial instability hypothesis’.
We are faced with the twin shocks on the economy, both internal and external. The imminent internal shock, as explained by Minsky, by moving from the safe zone of hedge financing to speculative and to ponzi financing, the riskiest zone. The external shock is the covid19 pandemic caused by nature (human cause is still under investigation). Where are we heading to? Minsky moment?
To Read part-1, which deals with theoretical background click here
References:
- Collateral Damage, Ending the Era of Ponzi Financing, Boston Consulting Group, January 2013
- Financial Instability Hypothesis and Current Common Problems of Rich Capitalist Economies, Hyman Minsky, Jerome Levy Institute Bard College, Hudson New York, November 7, 1994
- Global Debt Monitor, Sharp Spike in Debt Ratios, Institute of International Finance, 17 february 2021
- Planet Ponzi, Mitch Feierstein, Bantam Press, 2012
- Planet Ponzi: The Danger Debt Poses to the Western World, Spiegel online International, January 5, 2012
- Rising Corporate Debt Peril or Promise? Mckinsey Global Institute, June 2018
Part 3, the final portion gives answer to the question posed as the title. To read part 3 click here

Leave a comment